.png)
Automation across SDLC
Automation strategy across value stream


• Build Metrics & Dashboard
• Automation Framework Setup
• Build Verification Test
• API Automation
• Automation using SV
•Critical Functional Test
•API & UI Automation
•Regression Automation with UI & API
•Regression Automation with UI & API
•Journey Automation (Across apps)

Planning
Build
Design
Integration
SIT
UAT
Pre Pod
Uniform Framework Across Mobile, Web & API
Designing the right framework for greater reusability
.png)
Real Time Reporting
Life Cycle Automation
Test Environment Automation
Virtualize services across ecosystem to ensure speed is maintained across QE phases
Test Data Automation
Use of Synthetic data automation through API or database insert queries or Data sub setting using golden records or DB snapshot.
Test Execution Automation
Sanity, Regression, End-to-end journey test automation. API test automation including call chains.
Test Environment
Test Data
Test Execution

Automation Delivery Approach
.png)
Proposal/SOW
Assessment
Automation Strategy
Test Data Environment
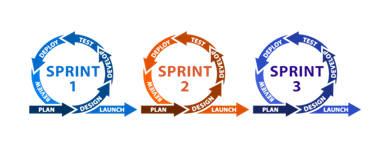
Sprint Wise Adoption
Scope Defination
Solution/ Test Design
Pre-Requisites
(Env,Data,Infra)
Scripting
Adoption Strategy
Training to customer team
Implementation
Test Sign Off
Automation Execution
.png)
Overview
AUTOMATION REGRESSION DASHBOARD
CLASS A APPLICATIONS
NON CLASS A APPLICATIONS
76
Class A Application Base
Class A Application list taken from APM (Application Portfolio Management)
Business & Enterprise Layer Applications consists of 70 applications including security, infra & external are filtered out
38
Application Executed
Application that will be decommissioned
(over period of next 18 months)
Low changed frequency (no major changes in the app in 6 months)
Covered Through other applications Y2
Security Utility
(Internal root CA)
-
=
22
Application In Transformation
Automated regression will be covered as a part of transformation & changed program.
(eg Intuition, BPM,MW Upgrade etc.)
16
Application In Scope
Applications to be covered for automated regression as a part of the project.
Class B Application list taken from APM (Application Portfolio Management)
Business & Enterprise Layer Applications consists of 70 applications including security, infra & external are filtered out
Application that will be decommissioned
(over period of next 18 months)
Low changed frequency (no major changes in the app in 6 months)
Covered Through other applications Y2
Security Utility
(Internal root CA)
Automated regression will be covered as a part of transformation & changed program.
(eg Intuition, BPM,MW Upgrade etc.)
Applications to be covered for automated regression as a part of the project.
+
10
Application In Scope
0
Application Executed
10
Application In Transformation
0
Application In Scope
-
=
+
Execution Reports Sample
.png)
.png)
.png)
.png)
Power BI Real Time Dashboard (Project Progress)
.png)
Power BI Real Time Dashboard (Overall Defect Details)
.png)
Azure Automation Summary – (UI Execution)
UI Automation Summary
• 116 UI Automation scenarios identified and Automated for including Positive and Negative conditions
• UI Automation scripts included in CI/CD pipeline to be executed post deployment in SIT
• Automated executions using multiple browser (Chrome & Edge) is performed for the end to end user journeys
• UI Static content (Labels and Error) validations using UI automated scripts
• Test artifact is generated post every run to detail the status of UI executions
.png)
Azure Automation Summary – (API Execution)
API Automation Summary
• 135 API In Scope for CIB and all have automated and integrated in CI/CD Pipeline
• Scripts executed prior to every SIT deployment to ensure functionality is working. Artefact generated in an automated manner
• Failures are reviewed on a daily basis and defects are reported in Azure
.png)
Automation ROI – Benefits to a Client
.png)
Automation ROI Summary
• Incremental progress has given ROI in 6 months
• Effort saving of 878 PDs realized against 660 PDs spent
• Increased frequency of execution
Automation Identified Defects - Benefits to a Client
.png)
Defect Identification
• Enhanced coverage of automation resulted in increased defect identification
• Exponential increase in defect identification month on month