.png)
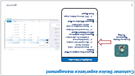
Mapping the Digital Testing Journey for Customer Experience
Pre Launch Testing
Experience Coverage
Performance Budget
BVPT
Component
Performance
Code Level
Performance
Performance Budget
BVPT
Component
Performance
Microservices
Assurance
Performance Budget
BVPT
LVPT
Congfig Analysis
CPU, Memory, Battery Utilization
Response Time Analysis
Client Side
Performance
Server Side Performance Testing
User & Transaction per hour
Performance
Infra
CX Testing
Tracking Broken Journeys w/Voice of Customer
User Feature Experience Review
Benchmarking Experience Index
Crowd Testing Validation
Device Experience


CX Testing Feedback Loop

Major Release
Minor Release
Server Side Performance Testing
User & Transaction Per Hour
Native Application
Functionalities
Features
Tools Stack
Device Matrix
Reliability Engineering- Maturity Framework


Design
Build
Test
Release
Observe
Remediate
Design Output
Defined NFR's
Performance Engineering
PROD Feedback Loop
Monitoring
Incident Management

• Zero Sev-1 Defects
• No Breakage in Critical Journeys
• Metrics driven corrective action
Customer Centric SLOs & SLIs
Continuous Testing
Capacity Benchmarking
User Experience
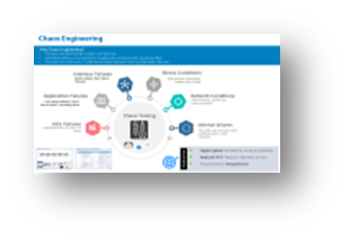
Chaos Engineering
Continuous Integration/ Delivery
Full Stack Observability
Noise Reduction
Auto Healing
Predictive Analysis
Anomaly Detection

• Consistent User Experience
• Faster Release Cycle
• Reduced MTTI/ MTTR
• Higher MTBF
Fault Tolerant Design
Open Telemetry
AI Driven Performance Engineering
Adaptive Release Management
Error Budget
Capacity Management
Digital Experience Management (DEM)

• Experience Driven Change Management
• Synergy between Business & IT Goals
Cloud Performance Engineering


Scalability
• Code & Query Tuning
• API Performance
• DB Tuning
• Horizontal and Vertical Scaling Configuration

Resiliency
•Service level resiliency
•Infrastructure resiliency- Network, VM, KS, Security layers, DB
•Interface delay and timeouts
•Load tolerance


Capacity Benchmarking
• Individual POD Capacity – Service Level
• Extrapolation to achieve target throughput
• Capacity provisioning and scaling factors-Workload level
• Service Quota- Validation & Optimization

FinOps
• Right Sizing- Calibrate on usage pattern, Autoscaling, Review unused resources
• Right Purchasing- Overcommitted reservations, cost effective choice
• Right Design- Storage management, Auto scaling/ Auto termination/ snoozing policies
• Collaboration- Finance, IT & Business
NFR & Reliability Engineering Approach
Availability
99.9% Up-time

Speed
99.9% transactions within a time

99.9% transactions within SLA
Consistency


Engineering Reliability
• NFR Management
• Shift-Left & Shift-Right
• Performance Engineering
• Capacity Benchmarking
Enhancing Customer Experience (Optional)
• Data Driven CXT
• Device Performance Engineering
• Continuous Improvement through Synthetic & RUM feedback
Observability Driven Testing
• Performance Engineering through Profiling
Building Resiliency
(Optional)
• Fault Tolerant architecture
• Chaos Engineering
Continuous Resiliency
(Optional))
• Pipeline Driven PT
• Environment Automation through Service Virtualization
• E2E NFR automation framework


NFR KPI Metrics
App Metrics
API Throughput & Latency
Thread Pool Utilization
GC Efficiency
Connection Pool Utilization
Heap Utilization
DB Metrics
Query Time
Query/ Sec
Concurrent connections
Indexing
Cache Hit ratio
IOPS
Lock waits & Deadlock
Microservices
Service Throughput
Error Rate
CPU/Memory Footprint
Timeouts
Engineering Reliability
• NFR Management
• Shift-Left & Shift-Right
• Performance Engineering
• Capacity Benchmarking
Engineering Reliability
• NFR Management
• Shift-Left & Shift-Right
• Performance Engineering
• Capacity Benchmarking
Infrastructure
CPU Utilization
Memory Utilization
Disk I/O
Disk Space Usage
Network Throughput
Load Balancing
Client-Side Metrics (Optional)
Response Time/ Latency
Throughput (TPS)
Transaction Pass%
App Crash rate
Device CPU/ Memory/ Battery Usage
Error Rate
Page Size
Network Roundtrip
App Launch Time
Engineering Reliability
• NFR Management
• Shift-Left & Shift-Right
• Performance Engineering
• Capacity Benchmarking
Quality Gates NFR
Criteria
Early PT
Full PT
Definition
Test Environment
Entry Criteria
Exit Criteria
Suspension
Criteria
Thresholds
Owner
Non-Functional Testing of API’s OR partially developed application conducted on SIT Environment conducted with low volume on functionally stable & interim build
Early Performance Testing (in SIT/UAT)
•At least 50% API’s or functionally stable application build
•Pre-requisites checklist completed
•Test Environment Readiness
•Test Plan approved & signed-off by stakeholders
•>=98% TC passed in SIT/UAT Testing (for stable functionality)
•Meeting Acceptance Criteria (thresholds provided below) and Signoff on the Early PT Report
•Provisional Project closure to meet timelines
•Abnormal Project termination
Performance test activities will be suspended under following circumstances:
•When the application is found to be unstable
•Application fails to produce the expected behavior functionality wise
Transaction Pass Rate >=99%
Transaction Response time at 90th Percentile <= 5 sec – Web Page
<= 2 sec – API
<= 10 sec for Document upload
<= 2 sec for Mobile action
Note: Above acceptance criteria are discussed and agreed with Project Team
TCOE (SIT)
Non-Functional Testing of Business-critical scenarios conducted on UAT Environment with designed workload on functionally stable & final build (Go live ready – executed during N and N-1 sprint)
Full Performance Testing (in UAT)
•Functionally Stable Build
•Pre-requisites checklist completed
•Test Environment Readiness
•Test Plan approved & signed-off by stakeholders
•>=98% TC passed in UAT Testing
•Meeting Acceptance Criteria (thresholds provided below) and Signoff on the Performance Test Reports
•Provisional Project closure to meet timelines
•Abnormal Project termination
Performance test activities will be suspended under following circumstances:
•When the application is found to be unstable
•Application fails to produce the expected behavior functionality wise
Transaction Pass Rate >=99%
Transaction Response time at 90th Percentile <= 5 sec – Web Page
<= 2 sec – API
<= 10 sec for Document upload
<= 2 sec for Mobile action
Note: Above acceptance criteria are discussed and agreed with Project Team
TCOE (UAT)